 Catálogo de datos del IEO
Catalog

884 record(s)
Type of resources
Categories
Available actions
Topics
INSPIRE themes
Keywords
Contact for the resource
Provided by
Years
Formats
Status
Service types
Scale
-
La información contenida en este conjunto de datos es la distribución de los puntos de presencia de la especie Pheronema carpenteri (esponja nido) obtenidos por medio de análisis de imágenes de muestreos no invasivos usados en el estudio de caracterización de hábitats, llevado a cabo en el ámbito del proyecto INTEMARES (LIFE15 IPE ES 012) por parte del equipo que trabaja en el COST-SANTANDER (IEO-CSIC). Se trata de la representación de la distribución espacial de los puntos de presencia de la especie Pheronema carpenteri (esponja nido) observados en el Sistema de Cañones Submarinos de Cap Bretón, que se propone como nuevo LIC. La zona que comprende los datos proporcionados abarca el área de estudio cuyos limites longitudinales son aproximadamente 3º 0’ W y 2º 3’ W de longitud y los latitudinales son de 43º 30’N y 43º 50’ N, su lecho marino, las aguas del sistema de cañones que comprende el cañón Cap Bretón y sus cañones tributarios, las plataformas intertributarias caracterizadas por pockmarks, la plataforma continental y el talud superior. Este conjunto de información se adquirieron durante los años 2019 y 2020, gracias a las campañas oceanográficas INTEMARES-A22C-0619, INTEMARES-A22C-0620, ambas a bordo del B/O Ramón Margalef. Se trata de un conjunto de datos compuesto por elementos vectoriales de tipo punto, donde cada elemento representa el punto de observación de un individuo de esta especie. La información geográfica recogida se almacenan en una base de datos espaciales. Estos trabajos se han financiado gracias al Proyecto LIFE IP INTEMARES (LIFE-IP INTEMARES - Integrated, Innovative and Participatory Management for N2000 network in the Marine Environment - LIFE15 IPE/ES/000012). Este proyecto integrado tiene el reto de sentar las bases para gestionar de forma eficaz los espacios marinos de la Red Natura 2000 y completar los trabajos y avances impulsados en el marco del proyecto LIFE+ INDEMARES, que logró dar un gran paso en materia de declaración de nuevos espacios.
-

La información contenida en este conjunto de datos es un ráster de la batimetría de la zona, con una resolución de 15 m, con profundidades comprendidas entre 1490 y 2687 m. La zona que comprende los datos proporcionados corresponde a los flancos del Banco de la Concepción y fondos adyacentes, situada en el noroeste de Lanzarote, perteneciente al archipiélago de las Islas Canarias e incluida en el LIC ESZZ15001 Banco de la Concepción. Los datos brutos que constituyen este ráster se adquirieron durante las campañas llevadas a cabo en el proyecto INDEMARES: INCOGEO_0310, INCOECO_0710, INCOECO_0611 e INCOECO_1012. Durante el proyecto INTEMARES se ha realizado el reprocesado de los datos batimétricos y de reflectividad disponibles, con el fin de ampliar el estudio geomorfológico de la zona. La información geográfica recogida se almacena en una base de datos espaciales. Los trabajos de reprocesado se han financiado gracias al Proyecto LIFE IP INTEMARES (LIFE-IP INTEMARES - Integrated, Innovative and Participatory Management for N2000 network in the Marine Environment - LIFE15 IPE/ES/000012). Este proyecto integrado tiene el reto de sentar las bases para gestionar de forma eficaz los espacios marinos de la Red Natura 2000 y completar los trabajos y avances impulsados en el marco del proyecto LIFE+ INDEMARES, que logró dar un gran paso en materia de declaración de nuevos espacios.
-

La información contenida en este conjunto de datos está referida a la campaña SECON16. Se trata de la representación de la distribución espacial de los puntos de muestreo del sedimento que se llevaron a cabo durante la referida campaña que tuvo lugar entre el 4 y el 15 de julio de 2016. El objetivo de la campaña es la determinación de compuestos orgánicos, inorgánicos y microplásticos, así como el estudio de posibles efectos biológicos de los contaminantes. La zona que comprenden los datos proporcionados abarca la Demarcación Marina Noratlántica de EEMM, concretamente desde la frontera con Portugal hasta la frontera con Francia. Se trata de un conjunto de datos compuesto por elementos puntuales, donde cada elemento representa el punto de toma de muestra del sedimento. Cada objeto tiene asociada una serie de variables alfanuméricas como son el nombre del punto de muestreo, el nombre de la campaña, la fecha y la georreferenciación, según el protocolo SIG del proyecto de Estrategias Marinas de España (ESMARES). La serie temporal de muestreos para el estudio de la contaminación en sedimentos en la demarcación noratlántica comenzó en el 2005, gracias a las campañas oceanográficas SECON y CONQUIBIOS. La información geográfica recogida se almacena en una base de datos espaciales. Estos trabajos se han financiado gracias al Proyecto “Asesoramiento Científico Técnico para la Protección del Medio Marino: Evaluación y Seguimiento de las Estrategias Marinas, seguimiento de los espacios marinos protegidos de competencia estatal (2018-2024)”. Las Estrategias Marinas son el instrumento de planificación del medio marino creado al amparo de la Directiva 2008/56/CE (modificada mediante la Directiva UE 2017/845) por la que se establece un marco de acción comunitaria para la política del medio marino (Directiva Marco sobre la Estrategia Marina), y tienen como principal objetivo, la consecución del Buen Estado Ambiental (BEA) de nuestros mares. Los 11 descriptores del Buen Estado Ambiental constituyen la base en que se sustenta la descripción y la determinación del buen estado ambiental del medio marino. Son establecidos por la Directiva en su anexo I. Las áreas marinas de evaluación se localizan dentro de las Demarcaciones Marinas definidas en el marco de las Estrategias Marinas de España, siendo estas Demarcaciones Marians las unidades utilizadas para la notificación a la Comisión Europea (Marine reporting units - MRU).
-
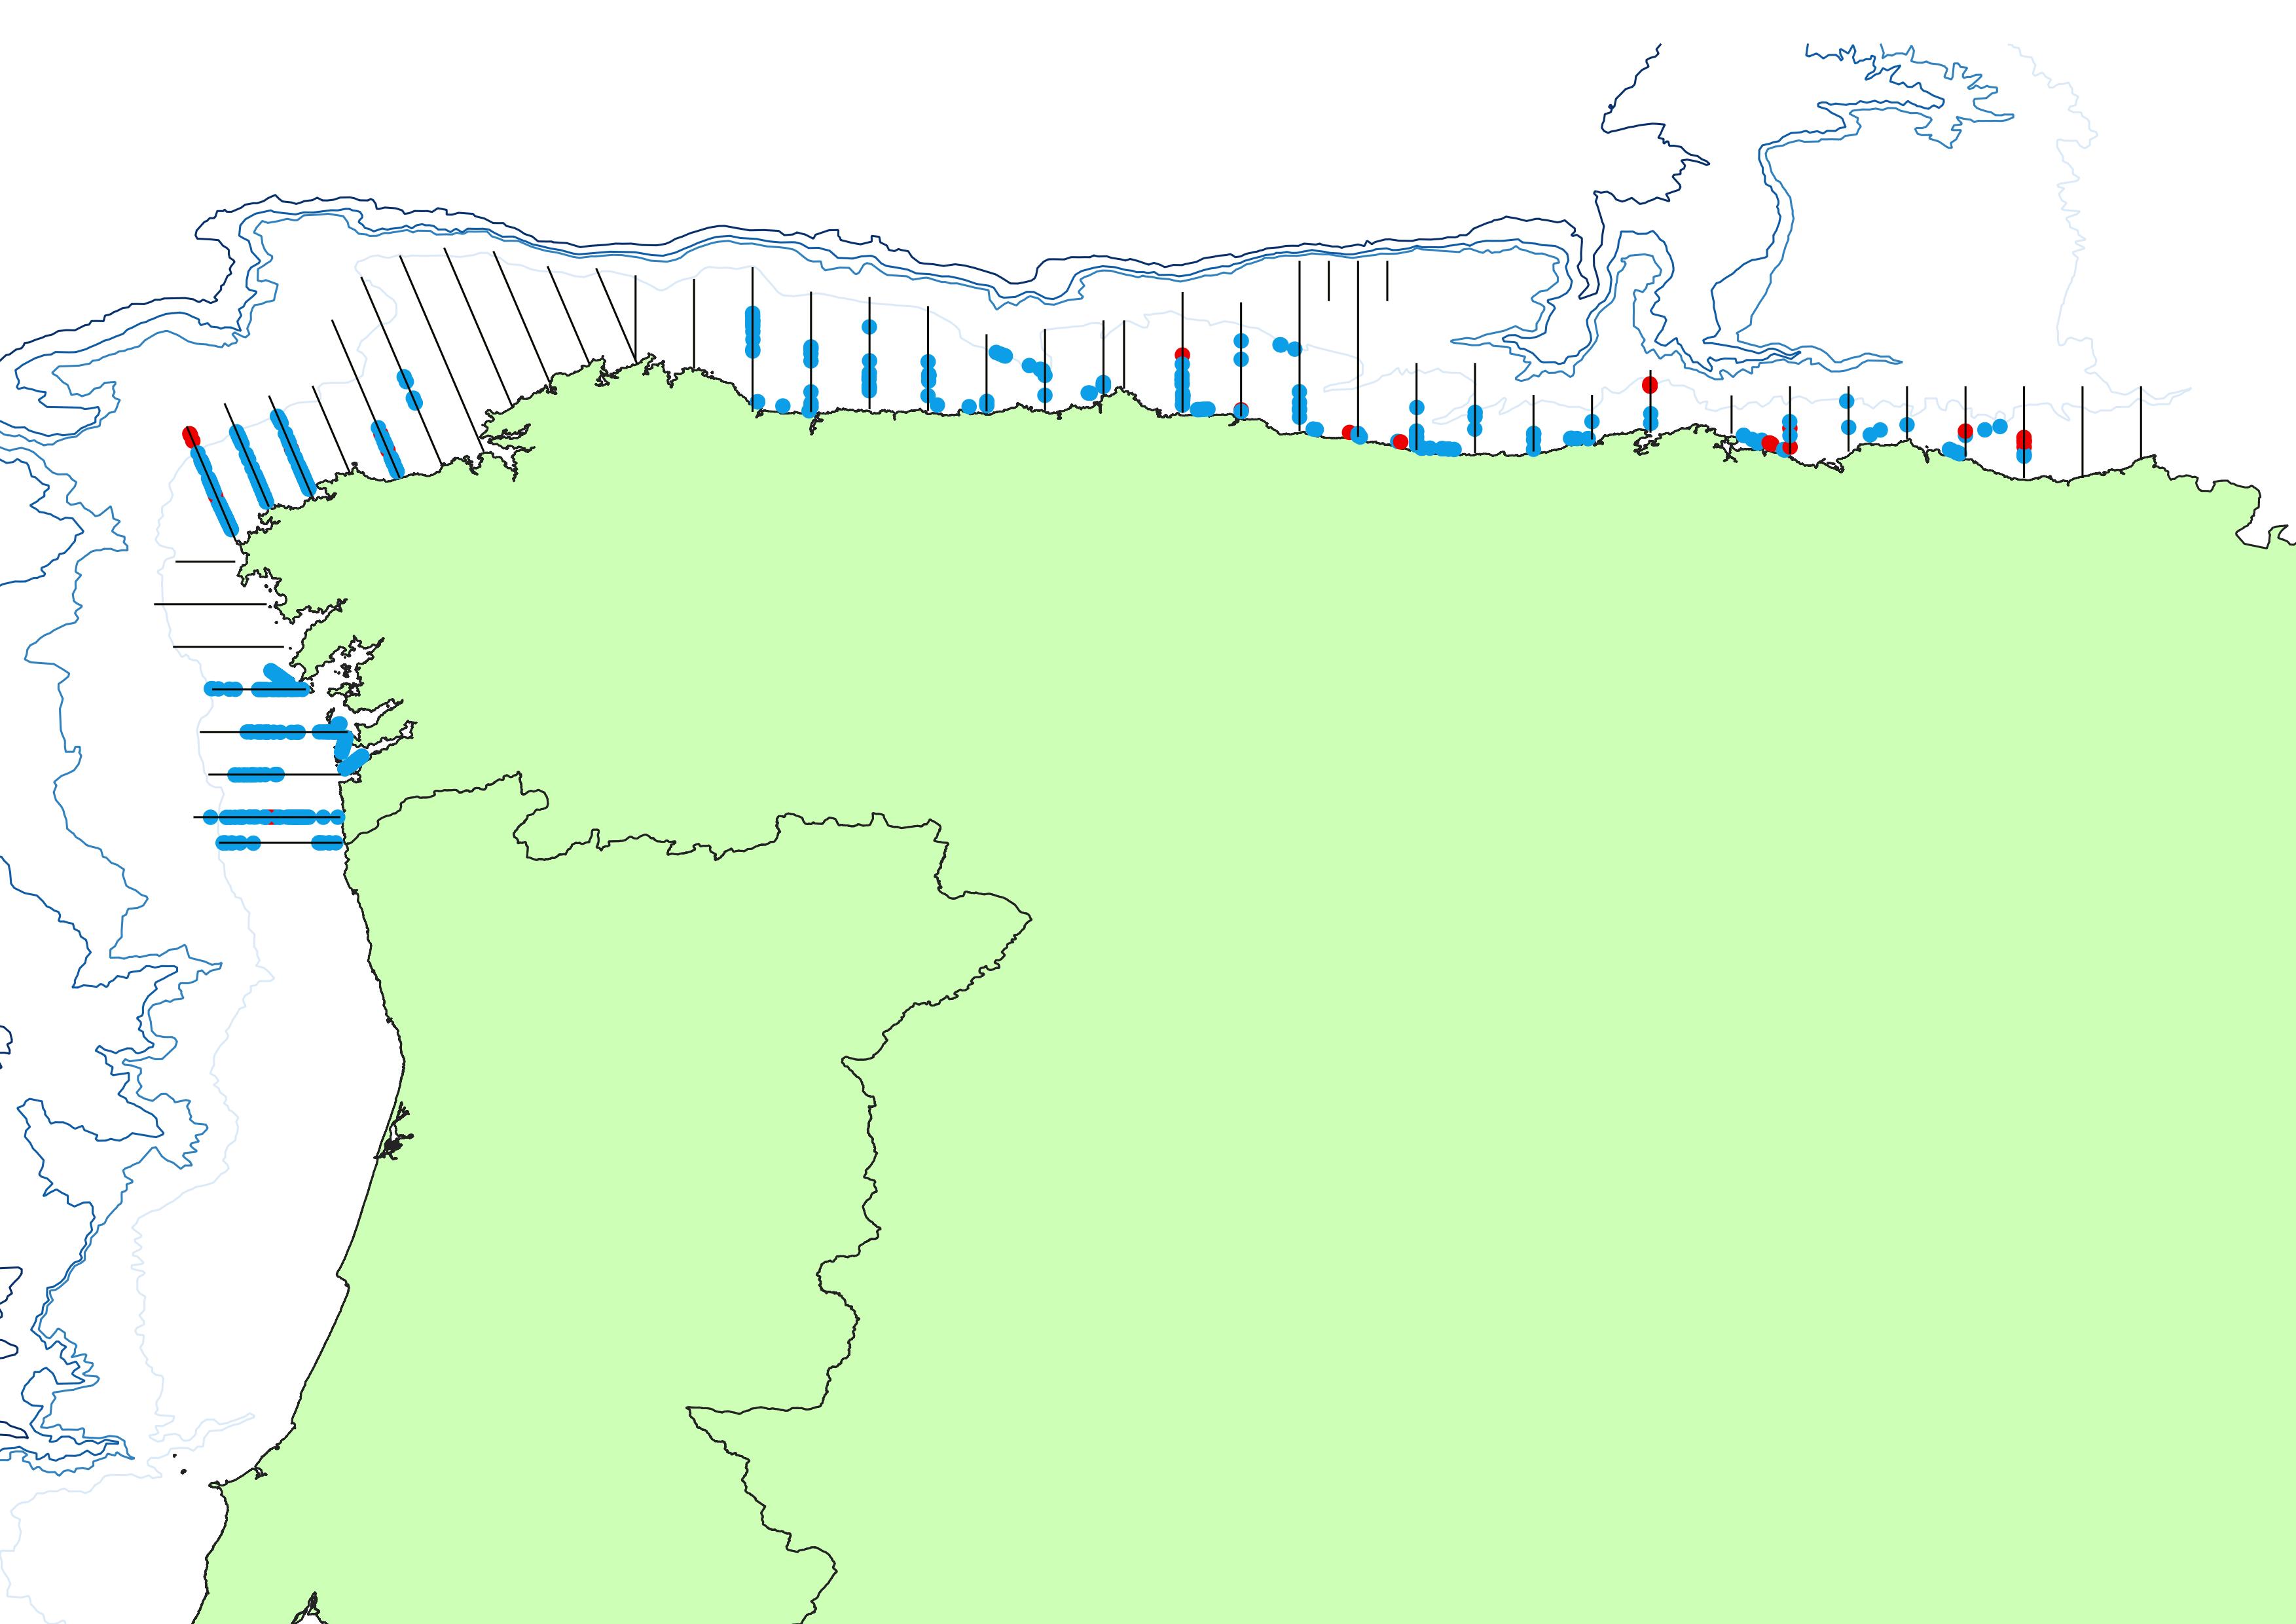
La información contenida en este conjunto de datos es referida a la campaña PELACUS0422 llevada a cabo entre el 2 y 30 de abril del año 2022. Se trata de la representación de la distribución espacial de las observaciones de cetáceos, aves y tortugas marinas recogidos durante los periodos con esfuerzo de muestreo. La zona que comprenden los datos proporcionados abarca la plataforma continental gallega y cantábrica (DMNOR). Se trata de un conjunto de datos compuesto por entidades puntuales, donde cada elemento representa observaciones de cetáceos, aves y tortugas marinas recogidos durante los periodos de la campaña con esfuerzo de muestreo. Cada objeto tiene asociada una serie de variables alfanuméricas como son: área de estudio, transecto, campaña, latitud, longitud, fecha, hora, especie (nombre científico), especie (nombre común), taxonID (correspondiente con base de datos EIDOS), número de grupo y observaciones. La elaboración de este conjunto de información geográfica comenzó en el año 2007, gracias a la participación del grupo de mamíferos marinos del IEO en la campaña. La información geográfica recogida se almacena en una base de datos espaciales. Estos trabajos se han financiado gracias al Proyecto “Asesoramiento Científico Técnico para la Protección del Medio Marino: Evaluación y Seguimiento de las Estrategias Marinas, seguimiento de los espacios marinos protegidos de competencia estatal (2018-2024)”. Las Estrategias Marinas son el instrumento de planificación del medio marino creado al amparo de la Directiva 2008/56/CE (modificada mediante la Directiva UE 2017/845) por la que se establece un marco de acción comunitaria para la política del medio marino (Directiva Marco sobre la Estrategia Marina), y tienen como principal objetivo, la consecución del Buen Estado Ambiental (BEA) de nuestros mares. Los 11 descriptores del Buen Estado Ambiental constituyen la base en que se sustenta la descripción y la determinación del buen estado ambiental del medio marino. Son establecidos por la Directiva en su anexo I. Las áreas marinas de evaluación se localizan dentro de las Demarcaciones Marinas definidas en el marco de las Estrategias Marinas de España, siendo estas Demarcaciones Marinas las unidades utilizadas para la notificación a la Comisión Europea (Marine reporting units - MRU).
-

La información contenida en este conjunto de datos corresponde a los puntos de muestreo de la campaña oceanográfica ESMARES0122 llevada a cabo del 30 de enero al 11 de febrero de 2022 en el litoral mediterráneo ibérico. La campaña se realizó en el marco del proyecto de las Estrategias Marinas de España (EEMM, Acción ESMARES2-C4A2). El objetivo de la campaña es continuar con el programa de vigilancia de la eutrofización en el litoral mediterráneo conforme a la estrategia de seguimiento de la eutrofización de MEDPOL iniciada en 2010, así como recopilar datos que permitan evaluar la calidad ambiental del medio marino conforme a las obligaciones derivadas de la Directiva Marco sobre Estrategia Marina de la UE (Directiva 2008/56/CE) y su transposición a la normativa española (Ley 41/2010, de 29 de diciembre, de protección del medio marino; BOE nº 317, 30 de diciembre de 2010). Se trata de la representación de la distribución espacial de variables fisicoquímicas (temperatura, salinidad, oxígeno disuelto y fluorescencia) procedentes de perfiles de CTD, así como muestras discretas recogidas a diferentes profundidades para análisis de variables biogeoquímicas (nutrientes inorgánicos disueltos, clorofila total, clorofila > 20 micras y CNH) y de la comunidad planctónica desde el picoplancton hasta el fitoplancton de mayor tamaño. La zona que comprenden los datos proporcionados abarca las demarcaciones Estrecho-Alborán (DM-ESAL) y Levantino Balear (DM-LEVA), desde Algeciras hasta Barcelona. Es un conjunto de datos compuesto por elementos puntuales, donde cada elemento representa una de las estaciones de muestreo realizadas en la campaña oceanográfica. Cada objeto tiene asociada una serie de variables alfanuméricas correspondiente con cada una de las variables analizadas. La información geográfica recogida se almacena en una base de datos espaciales. Estos trabajos se han financiado gracias al Proyecto “Asesoramiento Científico Técnico para la Protección del Medio Marino: Evaluación y Seguimiento de las Estrategias Marinas, seguimiento de los espacios marinos protegidos de competencia estatal (2018-2024)”. Las Estrategias Marinas son el instrumento de planificación del medio marino creado al amparo de la Directiva 2008/56/CE (modificada mediante la Directiva UE 2017/845) por la que se establece un marco de acción comunitaria para la política del medio marino (Directiva Marco sobre la Estrategia Marina), y tienen como principal objetivo, la consecución del Buen Estado Ambiental (BEA) de nuestros mares. Los 11 descriptores del Buen Estado Ambiental constituyen la base en que se sustenta la descripción y la determinación del buen estado ambiental del medio marino. Son establecidos por la Directiva en su anexo I. Las áreas marinas de evaluación se localizan dentro de las Demarcaciones Marinas definidas en el marco de las Estrategias Marinas de España, siendo estas Demarcaciones Marinas las unidades utilizadas para la notificación a la Comisión Europea (Marine reporting units - MRU).
-
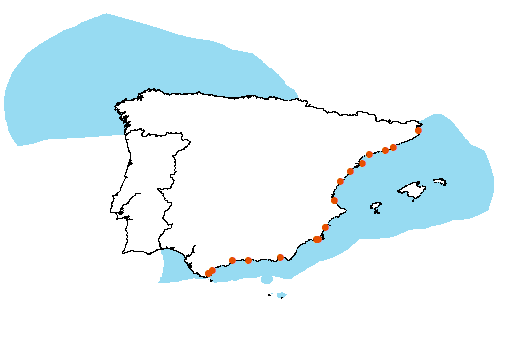
La información contenida en este conjunto de datos está referida a la campaña MEJI2019. Se trata de la representación de la distribución espacial de los puntos de muestreo del mejillón que se llevaron a cabo entre los meses de mayo y junio de 2019 para la determinación de metales pesados, compuestos organoclorados, hidrocarburos aromáticos policíclicos y éteres de bifenilos polibromados para los estudios de distribución temporal. Parte de estas muestras también se usarán para la evaluación de los efectos biológicos. La zona que comprenden los datos proporcionados abarcan las Demarcaciones Marinas Levantino-Balear (LEBA) y del Estrecho y Alborán (ESAL), ambas en el Mar Mediterráneo. Concretamente desde Islas Medas (Girona) hasta el Estrecho de Gibraltar (Cádiz). Se trata de un conjunto de datos compuesto por elementos puntuales, donde cada elemento representa el punto de toma de muestra del mejillón. Cada objeto tiene asociada una serie de variables alfanuméricas como son el nombre del punto de muestreo, el nombre de la campaña, la fecha y la georreferenciación, según el protocolo SIG del proyecto asociado a los programas de seguimiento del D8 de las Estrategias Marinas (EEMM). La serie temporal de muestreos para el estudio de la contaminación del mejillón en estas demarcaciones comenzó hace más de dos décadas. La información geográfica recogida se almacena en una base de datos espaciales. Estos trabajos se han financiado gracias al Proyecto “Asesoramiento Científico Técnico para la Protección del Medio Marino: Evaluación y Seguimiento de las Estrategias Marinas, seguimiento de los espacios marinos protegidos de competencia estatal (2018-2024)”. Las Estrategias Marinas son el instrumento de planificación del medio marino creado al amparo de la Directiva 2008/56/CE (modificada mediante la Directiva UE 2017/845) por la que se establece un marco de acción comunitaria para la política del medio marino (Directiva Marco sobre la Estrategia Marina), y tienen como principal objetivo, la consecución del Buen Estado Ambiental (BEA) de nuestros mares. Los 11 descriptores del Buen Estado Ambiental constituyen la base en que se sustenta la descripción y la determinación del buen estado ambiental del medio marino. Son establecidos por la Directiva en su anexo I. Las áreas marinas de evaluación se localizan dentro de las Demarcaciones Marinas definidas en el marco de las Estrategias Marinas de España, siendo estas Demarcaciones Marinas las unidades utilizadas para la notificación a la Comisión Europea (Marine reporting units - MRU).
-
La información contenida en este archivo corresponde a la navegación realizada para la obtención de los datos de batimetría y reflectividad con ecosonda multihaz (EM710) durante la campaña MOLAMEN3_0323, en las aguas de la demarcación Levantino-Balear. Se trata de la representación de la distribución espacial de las líneas por donde navegó el buque durante la adquisición de los datos. La zona que comprenden los datos proporcionados abarca aguas del Mar Mediterráneo en el archipiélago Balear. Se trata de un conjunto de datos compuesto por elementos lineales, donde cada elemento representa la situación de la navegación que realizó el buque oceanográfico, durante la adquisición de los datos acústicos. La información geográfica recogida se almacena en una base de datos espaciales. Estos trabajos se han financiado gracias al Proyecto “Asesoramiento Científico Técnico para la Protección del Medio Marino: Evaluación y Seguimiento de las Estrategias Marinas, seguimiento de los espacios marinos protegidos de competencia estatal (2018-2024)”. Las Estrategias Marinas son el instrumento de planificación del medio marino creado al amparo de la Directiva 2008/56/CE (modificada mediante la Directiva UE 2017/845) por la que se establece un marco de acción comunitaria para la política del medio marino (Directiva Marco sobre la Estrategia Marina), y tienen como principal objetivo, la consecución del Buen Estado Ambiental (BEA) de nuestros mares. Los 11 descriptores del Buen Estado Ambiental constituyen la base en que se sustenta la descripción y la determinación del buen estado ambiental del medio marino. Son establecidos por la Directiva en su anexo I. Las áreas marinas de evaluación se localizan dentro de las Demarcaciones Marinas definidas en el marco de las Estrategias Marinas de España, siendo estas Demarcaciones Marians las unidades utilizadas para la notificación a la Comisión Europea (Marine reporting units - MRU).
-
Se trata de la representación espacial de las estaciones de muestreo con el muestreador Bou de vara de la campaña CIRCASED 1022. La zona que comprenden los datos proporcionados están situados entre Cabo de Peñas (Asturias) y la frontera con Portugal (Galicia) Se trata de un conjunto de datos compuesto por elementos puntuales, donde cada elemento representa las estaciones del bou de vara (desde la llegada de la red al fondo hasta que abandona el fondo). Cada objeto tiene asociada una serie de variables alfanuméricas como son PROF_INICIO HORA_FIN LAT_FIN LON_FIN PROF_FIN LONGITUD_M VEL_BUQUE DURACION LAT_BUQ_INICIO LON_BUQ_INICIO LAT_BUQ_FIN LON_BUQ_FIN DESCRIPCIO OBSERVACIO Estos trabajos se han financiado gracias al Proyecto “Asesoramiento Científico Técnico para la Protección del Medio Marino: Evaluación y Seguimiento de las Estrategias Marinas, seguimiento de los espacios marinos protegidos de competencia estatal (2018-2024)”. Las Estrategias Marinas son el instrumento de planificación del medio marino creado al amparo de la Directiva 2008/56/CE (modificada mediante la Directiva UE 2017/845) por la que se establece un marco de acción comunitaria para la política del medio marino (Directiva Marco sobre la Estrategia Marina), y tienen como principal objetivo, la consecución del Buen Estado Ambiental (BEA) de nuestros mares. Los 11 descriptores del Buen Estado Ambiental constituyen la base en que se sustenta la descripción y la determinación del buen estado ambiental del medio marino. Son establecidos por la Directiva en su anexo I. Las áreas marinas de evaluación se localizan dentro de las Demarcaciones Marinas definidas en el marco de las Estrategias Marinas de España, siendo estas Demarcaciones Marinas las unidades utilizadas para la notificación a la Comisión Europea (Marine reporting units - MRU).
-
La información contenida en este archivo corresponde al área prospectada con ecosonda multihaz (EM710) durante la campaña CIRCASUR2020, en las aguas de la demarcación sudatlántica. Se trata de la representación del área donde se han obtenido datos tanto de batimetría como de reflectividad. La zona que comprenden los datos proporcionados abarca aguas del Golfo de Cádiz. Se trata de un conjunto de datos compuesto por elementos poligonales, donde cada elemento representa el área prospectada con EM710 con cobertura 100%. La elaboración de este conjunto de información geográfica comenzó en octubre de 2020, gracias la campaña oceanográfica CIRCASUR2020. La información geográfica recogida se almacena en una base de datos espaciales. Estos trabajos se han financiado gracias al Proyecto “Asesoramiento Científico Técnico para la Protección del Medio Marino: Evaluación y Seguimiento de las Estrategias Marinas, seguimiento de los espacios marinos protegidos de competencia estatal (2018-2024)”. Las Estrategias Marinas son el instrumento de planificación del medio marino creado al amparo de la Directiva 2008/56/CE (modificada mediante la Directiva UE 2017/845) por la que se establece un marco de acción comunitaria para la política del medio marino (Directiva Marco sobre la Estrategia Marina), y tienen como principal objetivo, la consecución del Buen Estado Ambiental (BEA) de nuestros mares. Los 11 descriptores del Buen Estado Ambiental constituyen la base en que se sustenta la descripción y la determinación del buen estado ambiental del medio marino. Son establecidos por la Directiva en su anexo I. Las áreas marinas de evaluación se localizan dentro de las Demarcaciones Marinas definidas en el marco de las Estrategias Marinas de España, siendo estas Demarcaciones Marians las unidades utilizadas para la notificación a la Comisión Europea (Marine reporting units - MRU).
-
La información contenida en este conjunto de datos es el posicionamiento de los perfiles obtenidos con sonda paramétrica TOPAS PS018 durante la campaña CANZEC-1170-2021-LEG1, en las aguas de la demarcación canaria. Se trata de la representación de la distribución espacial de las líneas donde se tienen perfiles verticales del sustrato. La zona que comprenden los datos proporcionados abarca las aguas adyacentes a la isla de Gran Canaria. Se trata de un conjunto de datos compuesto por elementos lineales, donde cada elemento representa la situación del perfil acústico obtenido con la ecosonda paramétrica TOPAS. La elaboración de este conjunto de información geográfica comenzó en el año 2019, gracias la campaña oceanográfica CANZEC2019. La información geográfica recogida se almacena en una base de datos espaciales. Estos trabajos se han financiado gracias al Proyecto “Asesoramiento Científico Técnico para la Protección del Medio Marino: Evaluación y Seguimiento de las Estrategias Marinas, seguimiento de los espacios marinos protegidos de competencia estatal (2018-2024)”. Las Estrategias Marinas son el instrumento de planificación del medio marino creado al amparo de la Directiva 2008/56/CE (modificada mediante la Directiva UE 2017/845) por la que se establece un marco de acción comunitaria para la política del medio marino (Directiva Marco sobre la Estrategia Marina), y tienen como principal objetivo, la consecución del Buen Estado Ambiental (BEA) de nuestros mares. Los 11 descriptores del Buen Estado Ambiental constituyen la base en que se sustenta la descripción y la determinación del buen estado ambiental del medio marino. Son establecidos por la Directiva en su anexo I. Las áreas marinas de evaluación se localizan dentro de las Demarcaciones Marinas definidas en el marco de las Estrategias Marinas de España, siendo estas Demarcaciones Marians las unidades utilizadas para la notificación a la Comisión Europea (Marine reporting units - MRU).