 Catálogo de datos del IEO
Category
interactiveResources
10 record(s)
Type of resources
Categories
Topics
Keywords
Contact for the resource
Provided by
Years
Formats
Status
-
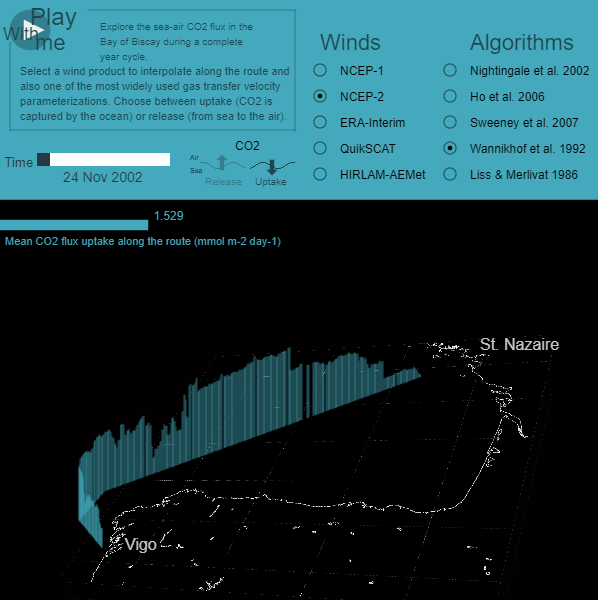
La estimación del flujo de CO2 en la superficie marina es altamente dependiente de la velocidad del viento a través de la parametrización de velocidad de transferencia gaseosa. Esta herramienta permite visualizar esta estimación usando datos obtenidos en un buque de oportunidad que transportaba vehículos de Citröen desde Vigo (España) a Saint Nazaire (Francia), desde octubre de 2002 a Julio de 2003. Puedes explorar la variabilidad especial y temporal del flujo de CO2 a lo largo de la ruta. Además, esta herramienta te permite visualizar las diferencias obtenidas en la estimación cuando se emplea un dato de viento procedente de otra fuente o bien se escoge otro algoritmo diferente para realizar la estimación. Si te gusta esta aplicación o quieres saber más, por favor, visita nuestro artículo publicado en Biogeosciences: Otero, P., X. A. Padin, M. Ruiz-Villarreal, L. M. García-García, A. F. Ríos and F. F. Pérez. Net sea–air CO2 flux uncertainties in the Bay of Biscay based on the choice of wind speed products and gas transfer parameterizations. Biogeosciences, 10, 2993-3005, 2013.
-
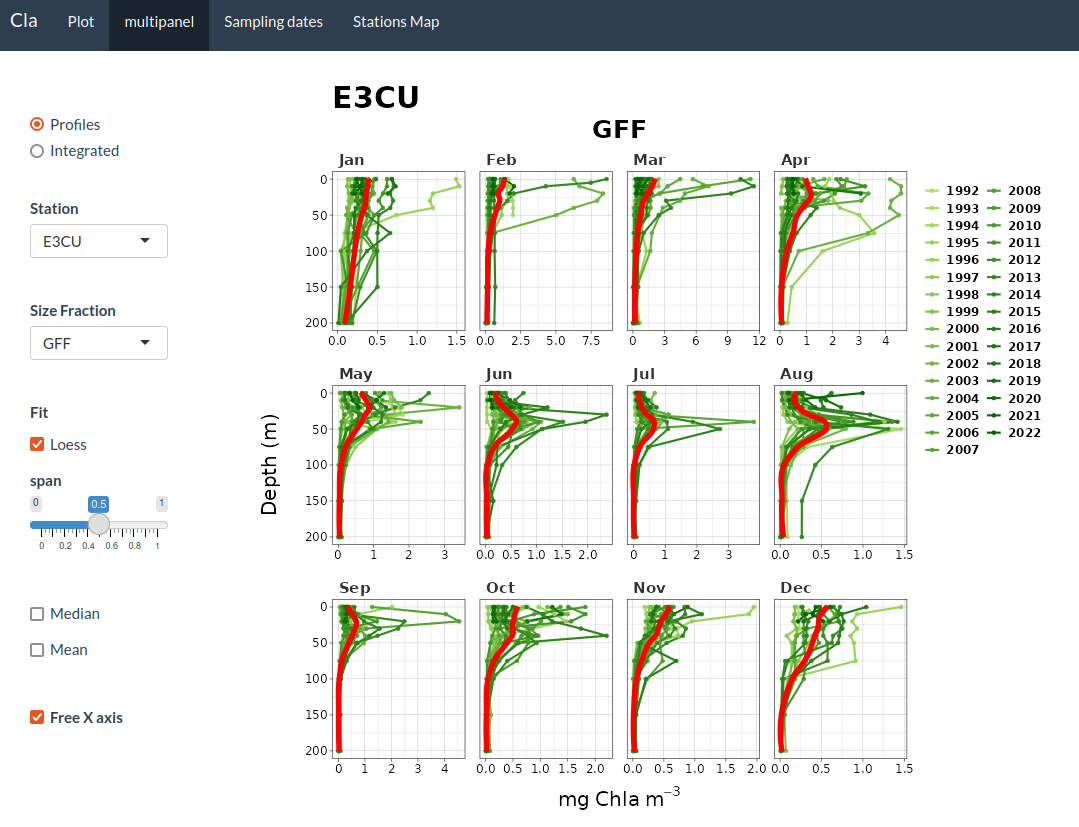
El visor permite la visualización interactiva de los datos de clorofila-a obtenidos cada mes en las campañas RADIALES (llamadas RADCAN o RCAN desde 2013 en el caso de los tres transectos del Cantábrico: Santander, Gijón y Cudillero). Muestra un panel lateral, donde se puede seleccionar la opción deseada para una serie de variables (estación, clase de tamaño, año, tipo de representación gráfica, …) y un panel principal donde aparecen los gráficos. Está organizado en cuatro pestañas: [1] 'Plot’ presenta los datos de una única estación (la lista de todas las estaciones y sus coordenadas geográficas están en https://seriestemporales-ieo.net, y representadas en un mapa en la última pestaña de este visor). [2] ‘multipanel’ muestra simultáneamente los gráficos individuales de todas las estaciones, facilitando la comparación entre ellas. [3] ‘Sampling dates’ representa gráficamente los meses, desde el inicio del proyecto, en que hay datos de clorofila disponibles. [4] ‘Stations Map’ muestra el mapa con la posición de todas las estaciones.
-

El visor permite la visualización interactiva de los datos de biomasa de zooplancton obtenidos cada mes en las campañas RADIALES (llamadas RADCAN o RCAN desde 2013 en el caso de los tres transectos del Cantábrico: Santander, Gijón y Cudillero). Muestra un panel lateral, donde se puede seleccionar la opción deseada para una serie de variables (estación, año, tipo de representación gráfica, …) y un panel principal donde aparecen los gráficos. Está organizado en cuatro pestañas: [1] ‘Plot’ presenta los datos de una única estación (la lista de todas las estaciones y sus coordenadas geográficas están en https://seriestemporales-ieo.net, y representadas en un mapa en la última pestaña de este visor). [2] ‘multipanel’ muestra simultáneamente los gráficos individuales de todas las estaciones, facilitando la comparación entre ellas. Permite seleccionar el tipo de gráfico. [3] ‘Sampling dates’ representa gráficamente los meses, desde el inicio del proyecto, en que hay datos de biomasa de zooplancton disponibles. [4] ‘Stations Map’ muestra el mapa con la posición de todas las estaciones.
-
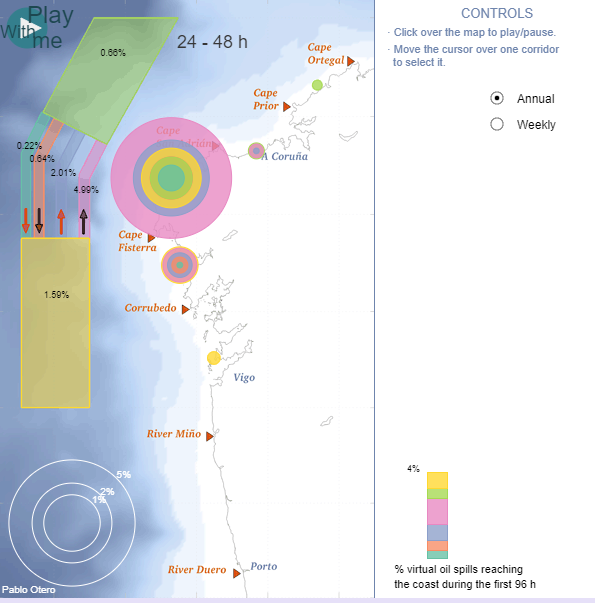
Esta herramienta visualiza la exposición costera de la Eurorregión Galicia - Norte de Portugal a los potenciales vertidos de hidrocarburos que pudieran venir del dispositivo de separación de tráfico de Fisterra. Estos corredores son atravesados cada año por cerca de 40,000 buques; más del 30% de ellos transporta sustancias peligrosas. Estos resultados corresponden a 2012, obtenidos mediante la ejecución de 8,686 simulaciones lagrangianas, cada una de las cuales contó con 2,345 partículas virtuales que fueron arrojadas sobre el corredor y seguidas durante las siguientes 96 horas. Las partículas fueron desplazadas por corrientes superficiales marinas obtenidas de un modelo oceánico realista de alta resolución y también por la acción del viento. Se muestran además de los cuatro corredores que integran el dispositivo, las zonas de aproximación. El número que aparece sobre cada corredor es la probabilidad de que una partícula alcance la costa durante el primer, segundo, tercer o cuarto día tras el vertido. Los círculos representan la probabilidad de que alcance un determinado segmento de la costa. Es posible filtrar los datos colocando el puntero del ratón sobre un determinado corredor, facilitando la visualización.
-
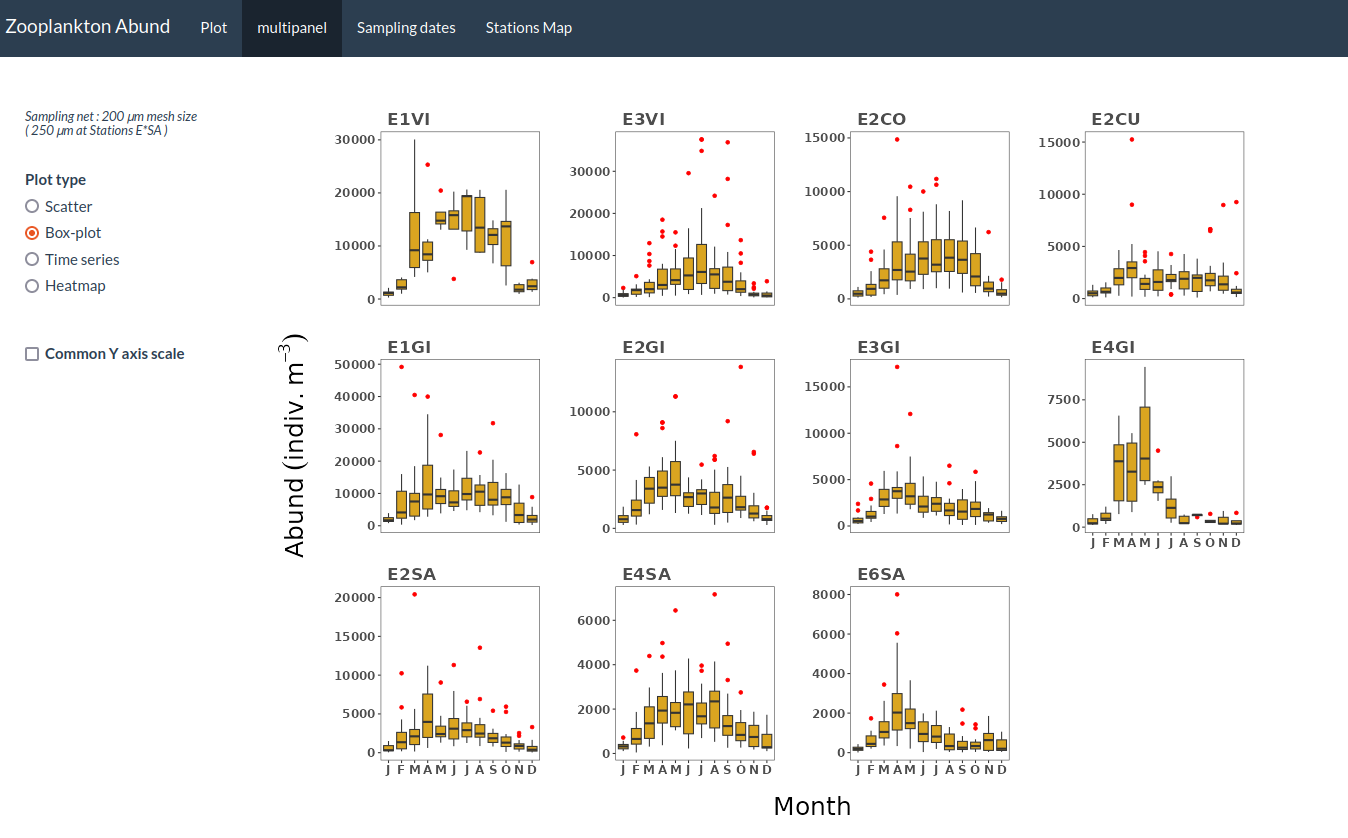
El visor permite la visualización interactiva de los datos de abundancia de zooplancton obtenidos cada mes en las campañas RADIALES (llamadas RADCAN o RCAN desde 2013 en el caso de los tres transectos del Cantábrico: Santander, Gijón y Cudillero). Muestra un panel lateral, donde se puede seleccionar la opción deseada para una serie de variables (estación, año, tipo de representación gráfica, …) y un panel principal donde aparecen los gráficos. Está organizado en cuatro pestañas: [1] ‘Plot’ presenta los datos de una única estación (la lista de todas las estaciones y sus coordenadas geográficas están en https://seriestemporales-ieo.net, y representadas en un mapa en la última pestaña de este visor). [2] ‘multipanel’ muestra simultáneamente los gráficos individuales de todas las estaciones, facilitando la comparación entre ellas. Permite seleccionar el tipo de gráfico. [3] ‘Sampling dates’ representa gráficamente los meses, desde el inicio del proyecto, en que hay datos de abundancia de zooplancton disponibles. [4] ‘Stations Map’ muestra el mapa con la posición de todas las estaciones.
-
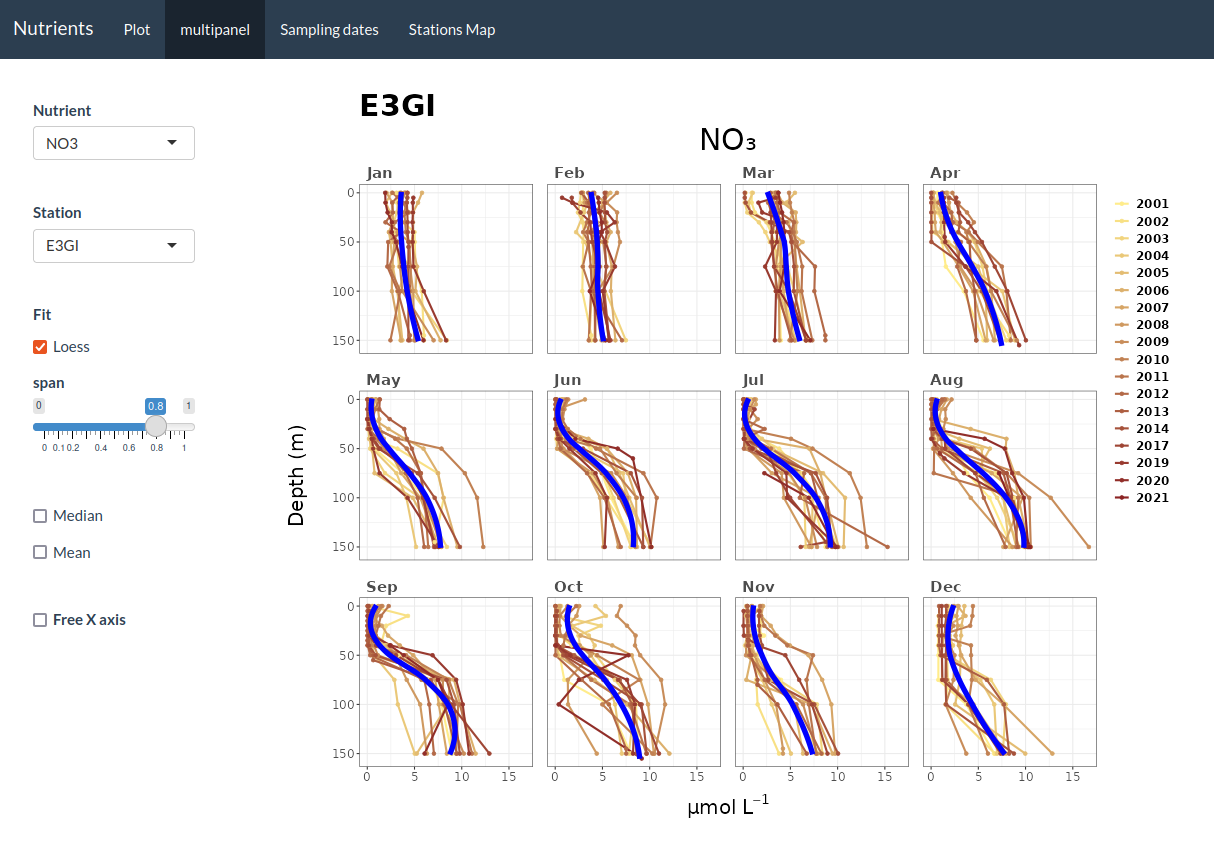
El visor permite la visualización interactiva de los datos obtenidos cada mes en las campañas RADIALES (llamadas RADCAN o RCAN desde 2013 en el caso de los tres transectos del Cantábrico: Santander, Gijón y Cudillero) de los cinco nutrientes muestreados: NO3, NO2, NH4, PO4 y SiO3. Muestra un panel lateral, donde se puede seleccionar la opción deseada para una serie de variables (estación, nutriente, año, …) y un panel principal donde aparecen los gráficos. Está organizado en cuatro pestañas: [1] ‘Plot’ presenta los datos de una única estación (la lista de todas las estaciones y sus coordenadas geográficas están en https://seriestemporales-ieo.net, y representadas en un mapa en la última pestaña de este visor). [2] ‘multipanel’ muestra simultáneamente los gráficos individuales de todas las estaciones, facilitando la comparación entre ellas. [3] ‘Sampling dates’ representa gráficamente los meses, desde el inicio del proyecto, en que hay datos disponibles de cada uno de los nutrientes. [4] ‘Stations Map’ muestra el mapa con la posición de todas las estaciones.
-
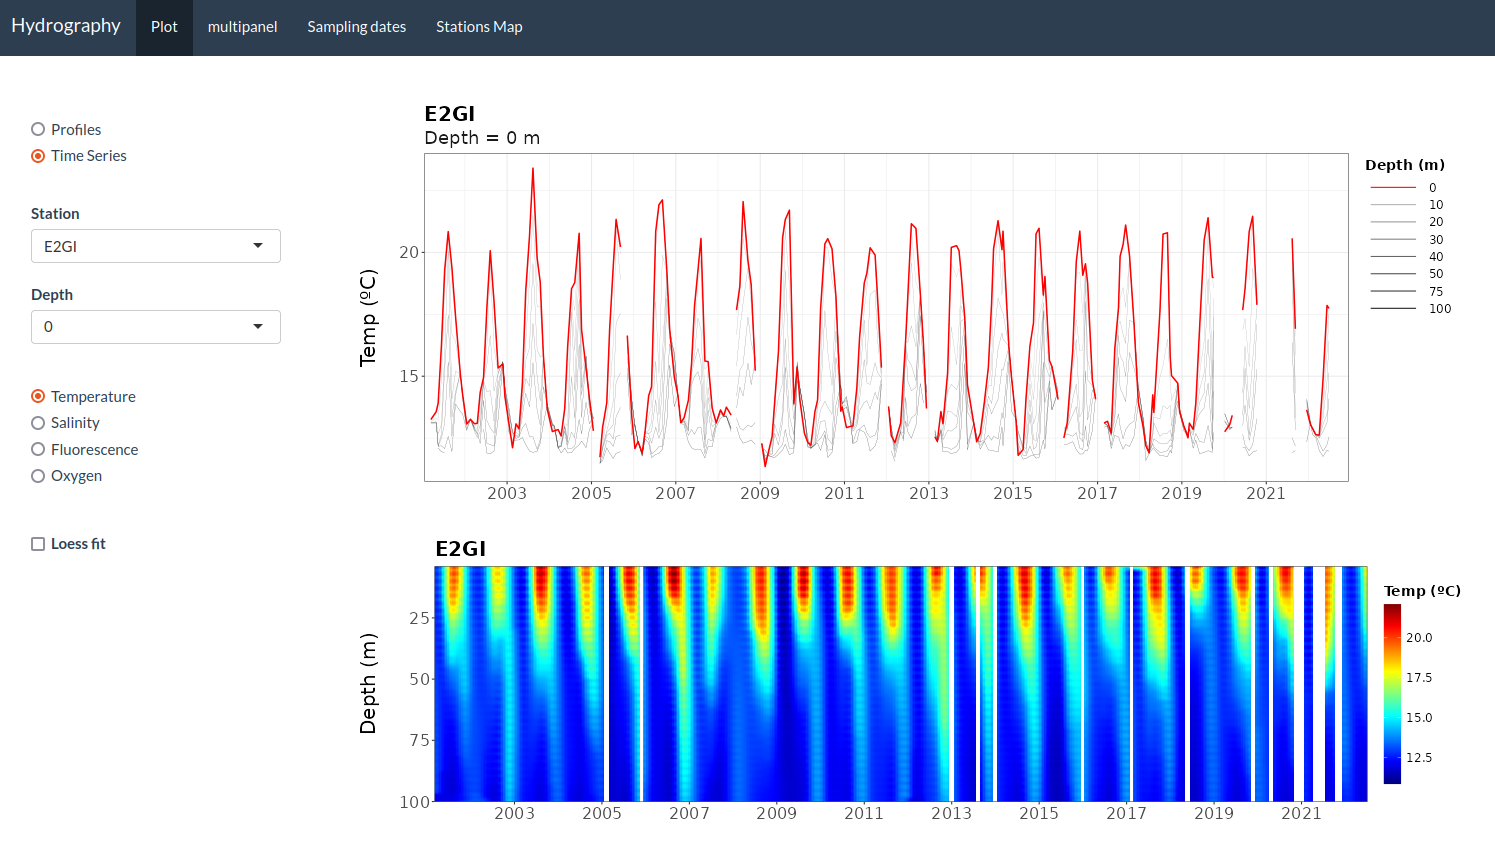
El visor permite la visualización interactiva de los datos de CTD obtenidos cada mes en las campañas RADIALES (llamadas RADCAN o RCAN desde 2013), concretamente de cuatro variables fisicoquímicas: temperatura, salinidad, fluorescencia y oxígeno disuelto. A diferencia del resto de visores de datos de RADIALES, en este caso solo se dispone de los datos de los transectos del Cantábrico (Santander, Gijón y Cudillero). Muestra un panel lateral, donde se puede seleccionar la opción deseada para una serie de parámetros (estación, variable fisicoquímica, año, tipo de representación gráfica …) y un panel principal donde aparecen los gráficos. Está organizado en cuatro pestañas: [1] ‘Plot’ presenta los datos de una única estación (la lista de todas las estaciones y sus coordenadas geográficas están en https://seriestemporales-ieo.net, y representadas en un mapa en la última pestaña de este visor). Para cada estación permite seleccionar i) la representación simultánea de los perfiles de las cuatro variables fisicoquímicas en un mes determinada, o ii) la serie temporal de cada variable a distintas profundidades. [2] ‘multipanel’ muestra los doces perfiles mensuales de la estación y variable seleccionadas, permitiendo resaltar los perfiles de años particulares para facilitar la comparación interanual. [3] ‘Sampling dates’ representa gráficamente los meses en que hay datos disponibles de cada una de las variables. [4] ‘Stations Map’ muestra el mapa con la posición de todas las estaciones.
-
El Visor de información marina muestra información de la naturaleza del fondo, batimetría, límites de reservas, información ambiental, caladeros de pesca, arrecifes artificiales y límites administrativos, (a título informativo y sin validez legal).
-
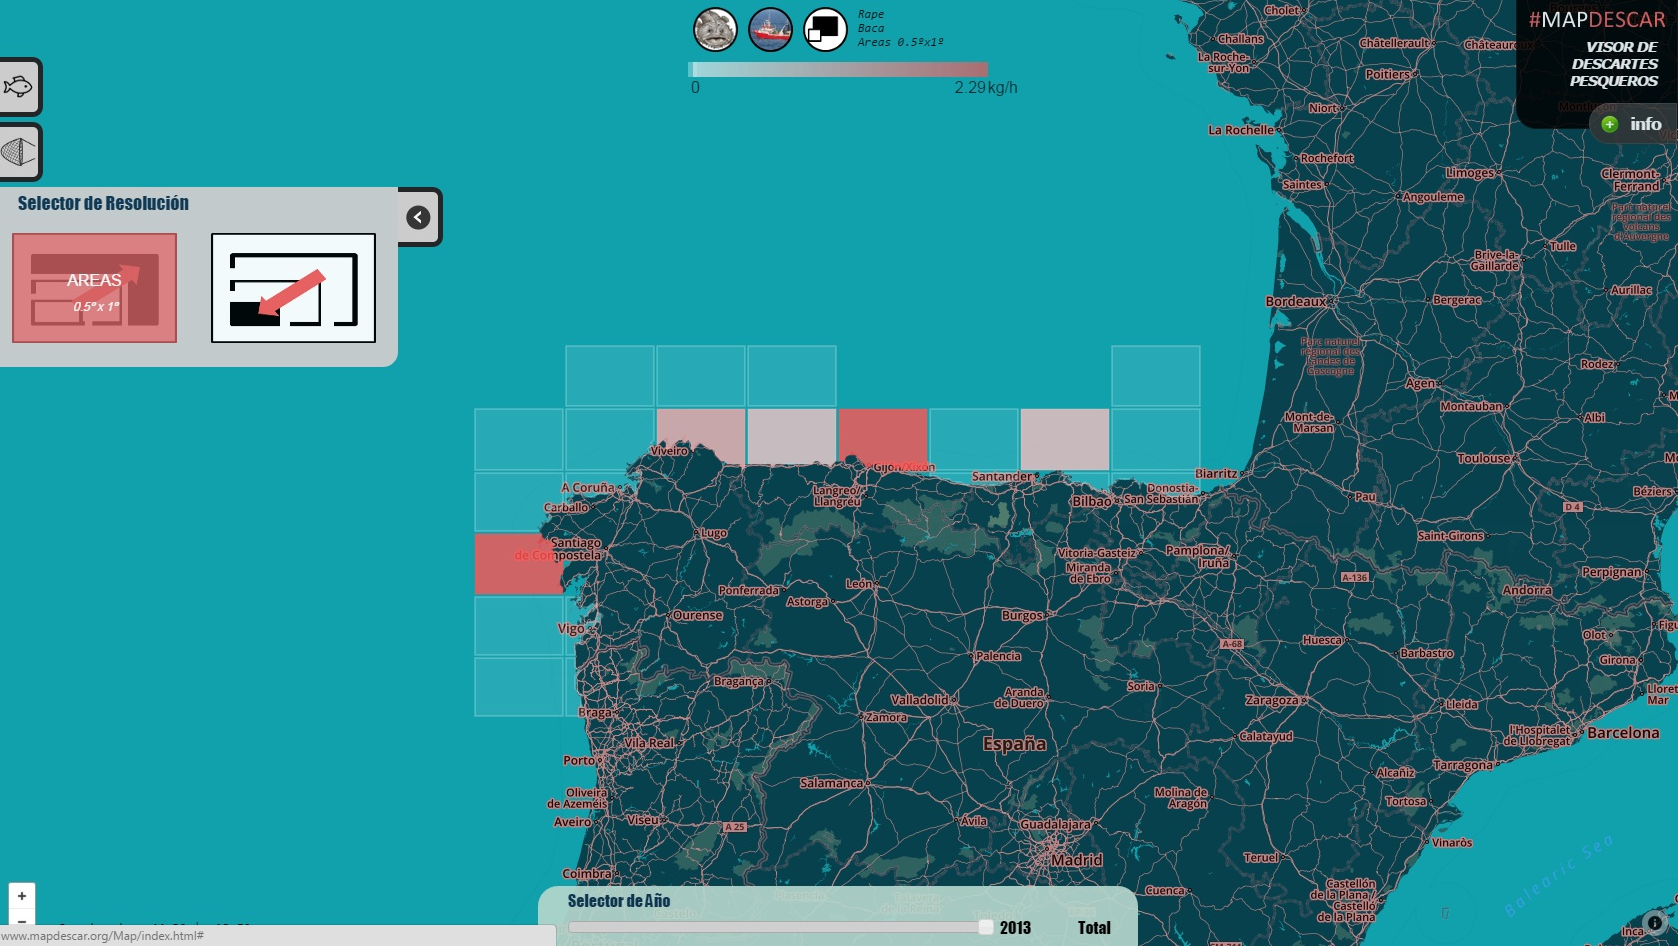
Visor cartográfico que visualiza los datos de descartes pesqueros recogidos por observadores científicos a bordo de buques comerciales. Las unidades hacen referencia a la cantidad de pescado (Kg) que se descarta por hora de pesca o bien por marea en el caso de artes fijas.
-
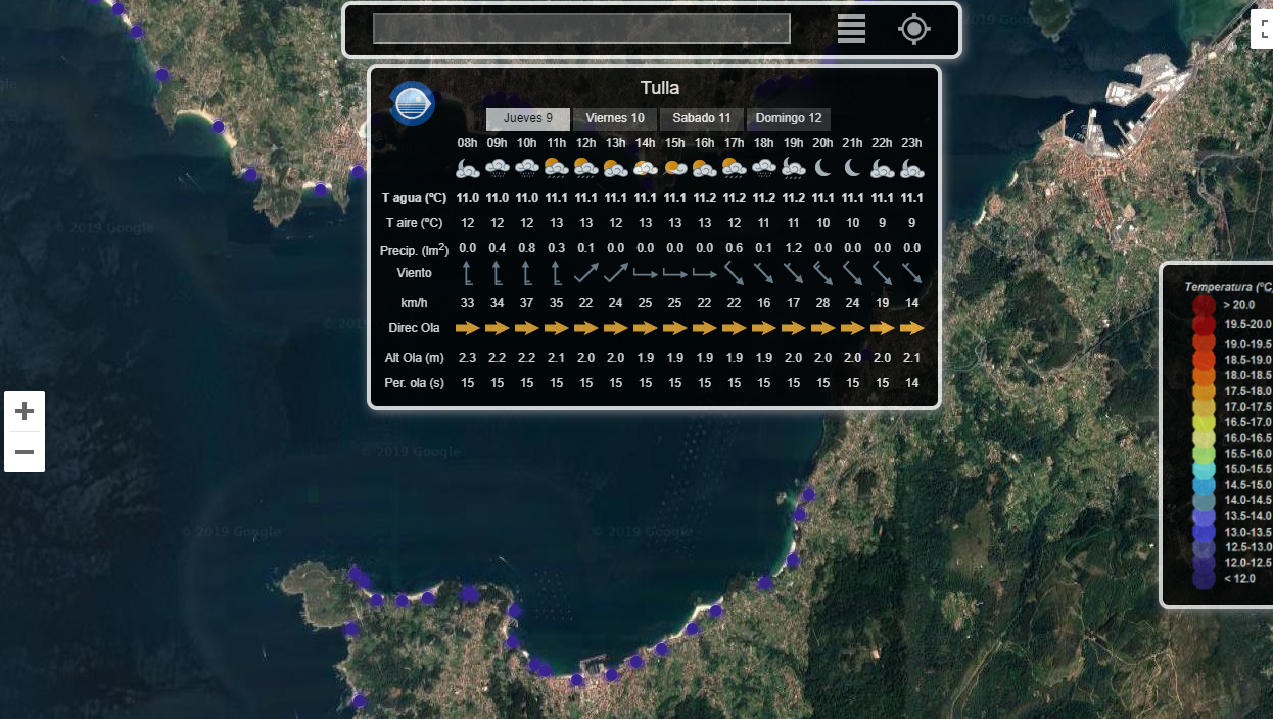
En 2013, el Instituto Español de Oceanografía (IEO) desarrolló un servicio de datos océano-meteorógicos (http://playas.ieo.es) especialmente centrado en proporcionar la temperatura de la superficie del mar en las playas de la cornisa ibérica atlántica. Aunque el servicio web está dirigido a la visualización de la temperatura del agua en más de mil playas, también proporciona un pronóstico de 3 días de un conjunto de otras variables meteoceánicas (temperatura del aire, velocidad y dirección del viento, altura de las olas, período y dirección) y mareas).