 Catálogo de datos del IEO
Keyword
RADCAN
5 record(s)
Type of resources
Categories
Topics
Keywords
Contact for the resource
Provided by
Years
Status
-
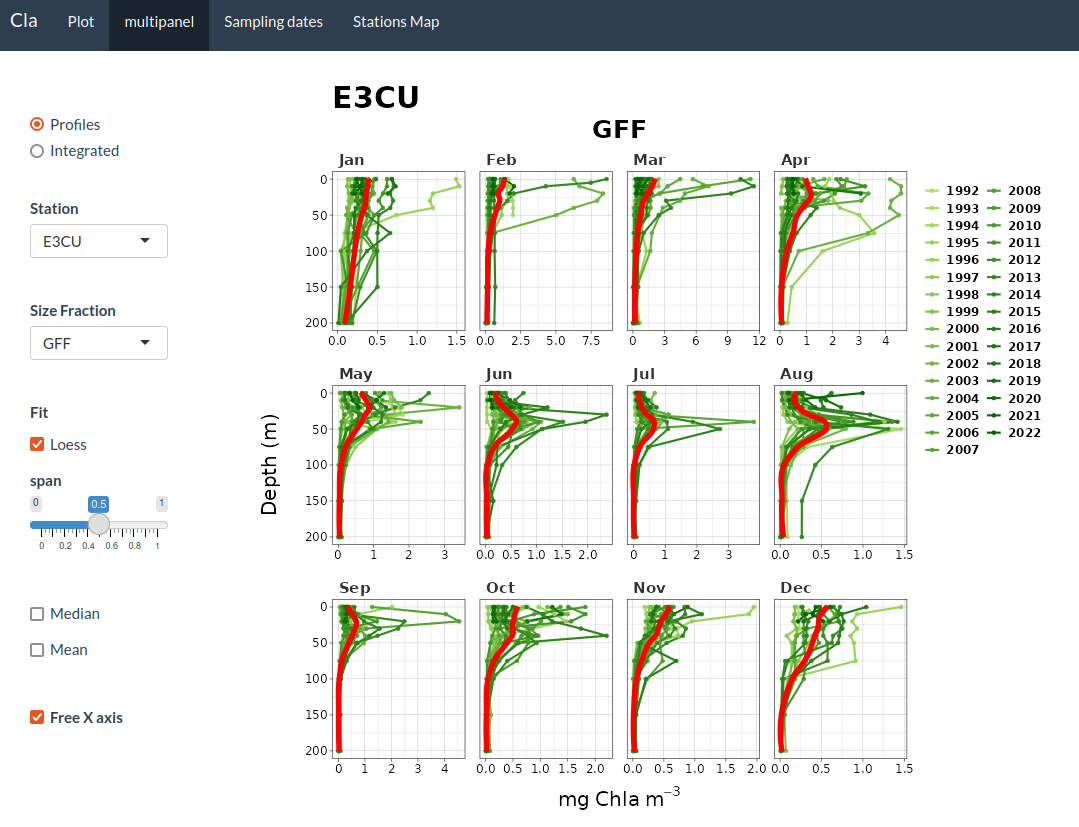
El visor permite la visualización interactiva de los datos de clorofila-a obtenidos cada mes en las campañas RADIALES (llamadas RADCAN o RCAN desde 2013 en el caso de los tres transectos del Cantábrico: Santander, Gijón y Cudillero). Muestra un panel lateral, donde se puede seleccionar la opción deseada para una serie de variables (estación, clase de tamaño, año, tipo de representación gráfica, …) y un panel principal donde aparecen los gráficos. Está organizado en cuatro pestañas: [1] 'Plot’ presenta los datos de una única estación (la lista de todas las estaciones y sus coordenadas geográficas están en https://seriestemporales-ieo.net, y representadas en un mapa en la última pestaña de este visor). [2] ‘multipanel’ muestra simultáneamente los gráficos individuales de todas las estaciones, facilitando la comparación entre ellas. [3] ‘Sampling dates’ representa gráficamente los meses, desde el inicio del proyecto, en que hay datos de clorofila disponibles. [4] ‘Stations Map’ muestra el mapa con la posición de todas las estaciones.
-

El visor permite la visualización interactiva de los datos de biomasa de zooplancton obtenidos cada mes en las campañas RADIALES (llamadas RADCAN o RCAN desde 2013 en el caso de los tres transectos del Cantábrico: Santander, Gijón y Cudillero). Muestra un panel lateral, donde se puede seleccionar la opción deseada para una serie de variables (estación, año, tipo de representación gráfica, …) y un panel principal donde aparecen los gráficos. Está organizado en cuatro pestañas: [1] ‘Plot’ presenta los datos de una única estación (la lista de todas las estaciones y sus coordenadas geográficas están en https://seriestemporales-ieo.net, y representadas en un mapa en la última pestaña de este visor). [2] ‘multipanel’ muestra simultáneamente los gráficos individuales de todas las estaciones, facilitando la comparación entre ellas. Permite seleccionar el tipo de gráfico. [3] ‘Sampling dates’ representa gráficamente los meses, desde el inicio del proyecto, en que hay datos de biomasa de zooplancton disponibles. [4] ‘Stations Map’ muestra el mapa con la posición de todas las estaciones.
-
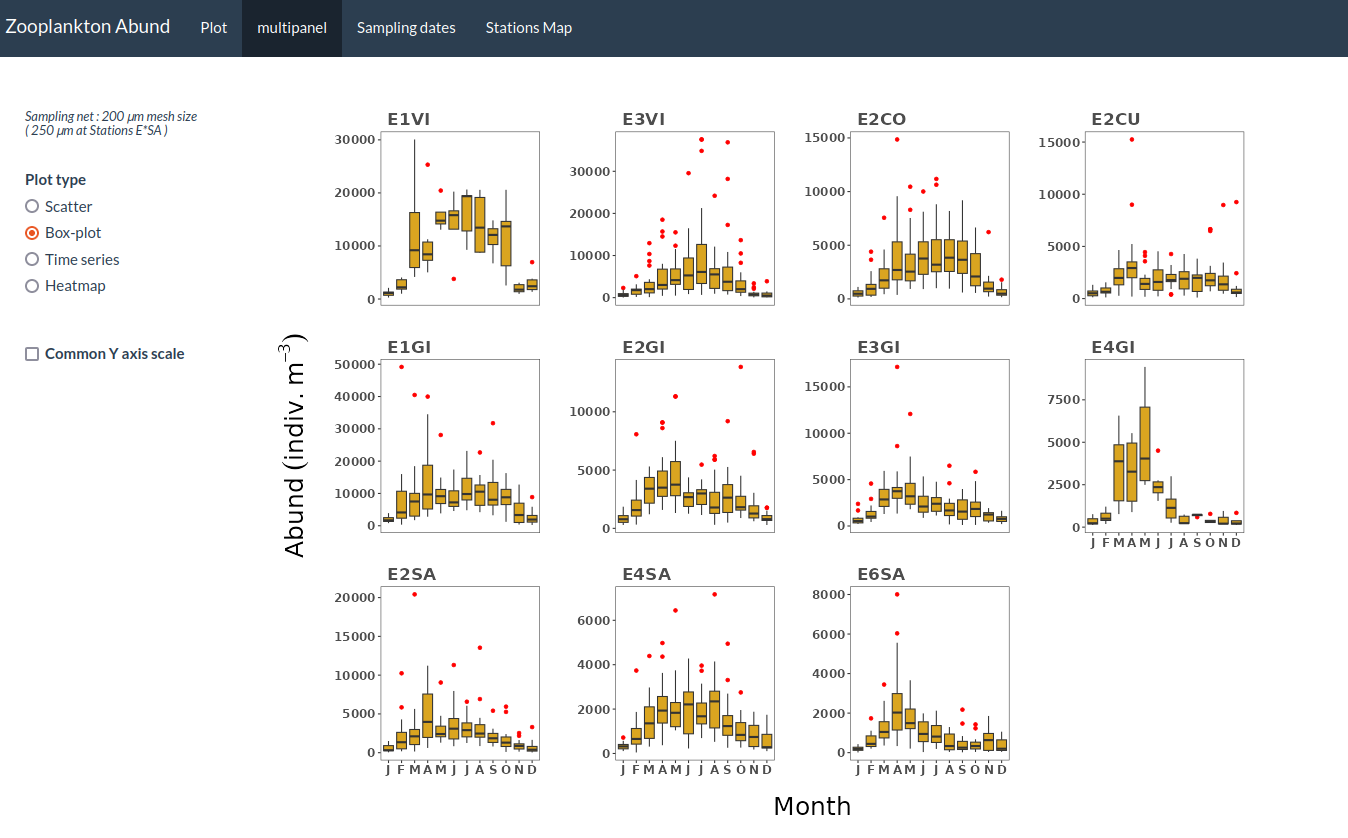
El visor permite la visualización interactiva de los datos de abundancia de zooplancton obtenidos cada mes en las campañas RADIALES (llamadas RADCAN o RCAN desde 2013 en el caso de los tres transectos del Cantábrico: Santander, Gijón y Cudillero). Muestra un panel lateral, donde se puede seleccionar la opción deseada para una serie de variables (estación, año, tipo de representación gráfica, …) y un panel principal donde aparecen los gráficos. Está organizado en cuatro pestañas: [1] ‘Plot’ presenta los datos de una única estación (la lista de todas las estaciones y sus coordenadas geográficas están en https://seriestemporales-ieo.net, y representadas en un mapa en la última pestaña de este visor). [2] ‘multipanel’ muestra simultáneamente los gráficos individuales de todas las estaciones, facilitando la comparación entre ellas. Permite seleccionar el tipo de gráfico. [3] ‘Sampling dates’ representa gráficamente los meses, desde el inicio del proyecto, en que hay datos de abundancia de zooplancton disponibles. [4] ‘Stations Map’ muestra el mapa con la posición de todas las estaciones.
-
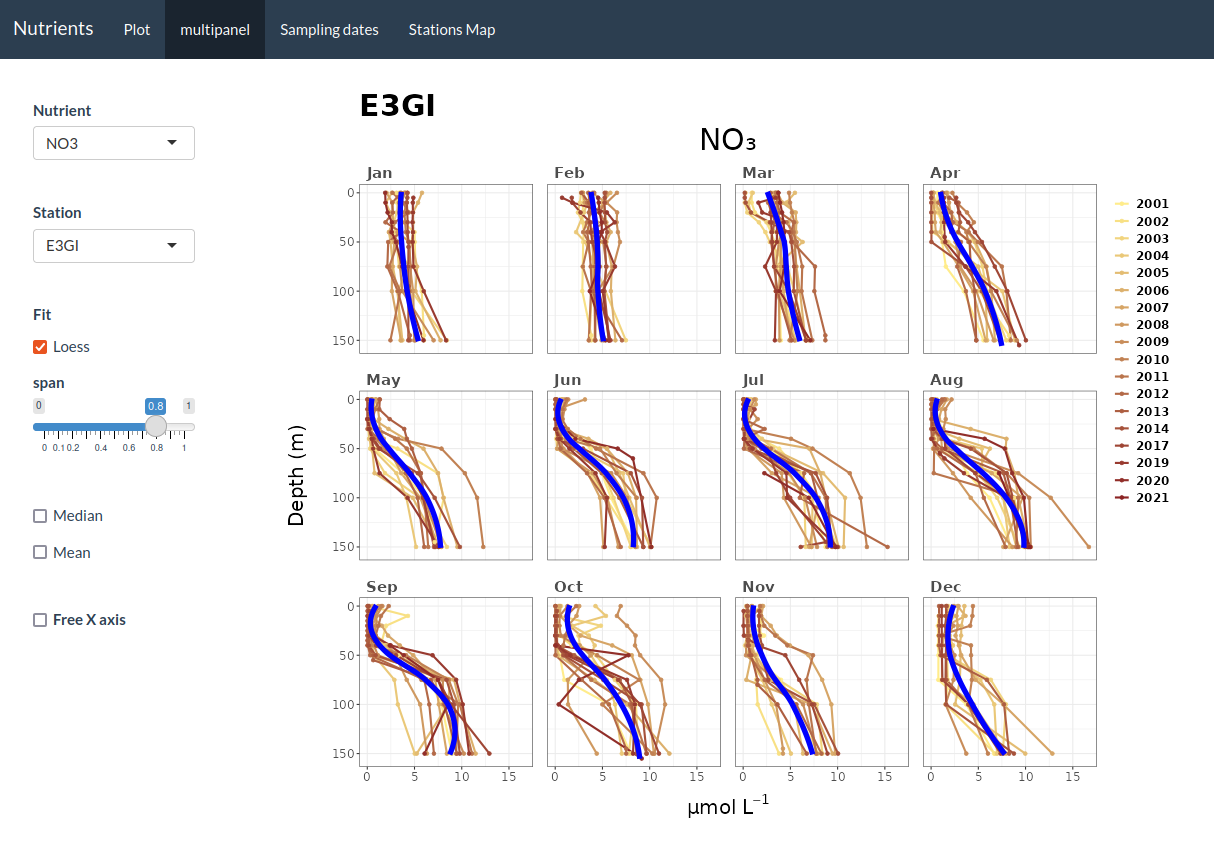
El visor permite la visualización interactiva de los datos obtenidos cada mes en las campañas RADIALES (llamadas RADCAN o RCAN desde 2013 en el caso de los tres transectos del Cantábrico: Santander, Gijón y Cudillero) de los cinco nutrientes muestreados: NO3, NO2, NH4, PO4 y SiO3. Muestra un panel lateral, donde se puede seleccionar la opción deseada para una serie de variables (estación, nutriente, año, …) y un panel principal donde aparecen los gráficos. Está organizado en cuatro pestañas: [1] ‘Plot’ presenta los datos de una única estación (la lista de todas las estaciones y sus coordenadas geográficas están en https://seriestemporales-ieo.net, y representadas en un mapa en la última pestaña de este visor). [2] ‘multipanel’ muestra simultáneamente los gráficos individuales de todas las estaciones, facilitando la comparación entre ellas. [3] ‘Sampling dates’ representa gráficamente los meses, desde el inicio del proyecto, en que hay datos disponibles de cada uno de los nutrientes. [4] ‘Stations Map’ muestra el mapa con la posición de todas las estaciones.
-
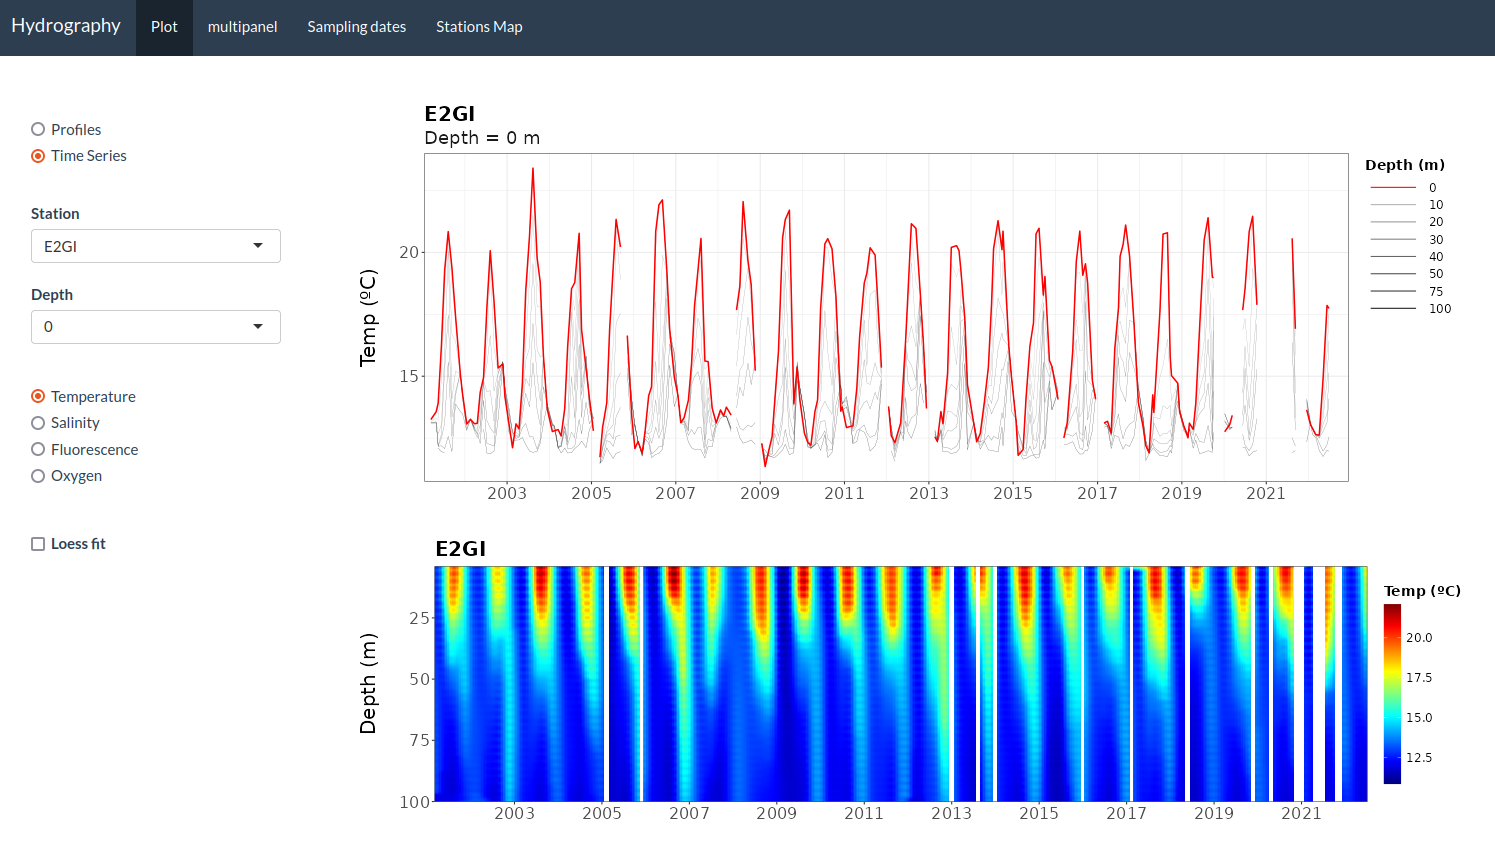
El visor permite la visualización interactiva de los datos de CTD obtenidos cada mes en las campañas RADIALES (llamadas RADCAN o RCAN desde 2013), concretamente de cuatro variables fisicoquímicas: temperatura, salinidad, fluorescencia y oxígeno disuelto. A diferencia del resto de visores de datos de RADIALES, en este caso solo se dispone de los datos de los transectos del Cantábrico (Santander, Gijón y Cudillero). Muestra un panel lateral, donde se puede seleccionar la opción deseada para una serie de parámetros (estación, variable fisicoquímica, año, tipo de representación gráfica …) y un panel principal donde aparecen los gráficos. Está organizado en cuatro pestañas: [1] ‘Plot’ presenta los datos de una única estación (la lista de todas las estaciones y sus coordenadas geográficas están en https://seriestemporales-ieo.net, y representadas en un mapa en la última pestaña de este visor). Para cada estación permite seleccionar i) la representación simultánea de los perfiles de las cuatro variables fisicoquímicas en un mes determinada, o ii) la serie temporal de cada variable a distintas profundidades. [2] ‘multipanel’ muestra los doces perfiles mensuales de la estación y variable seleccionadas, permitiendo resaltar los perfiles de años particulares para facilitar la comparación interanual. [3] ‘Sampling dates’ representa gráficamente los meses en que hay datos disponibles de cada una de las variables. [4] ‘Stations Map’ muestra el mapa con la posición de todas las estaciones.