Keyword
SPAIN
31 record(s)
Type of resources
Available actions
INSPIRE themes
Provided by
Years
Formats
Status
-
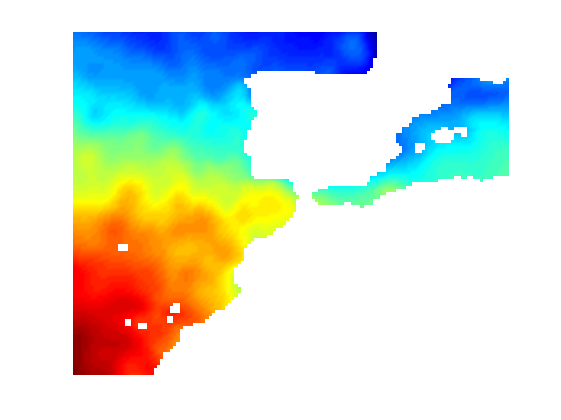
Climatología mensual de temperatura para la zona de Península Ibérica, Baleares e Islas canarias, con resolución espacial de 0.2º y 33 niveles verticales.
-
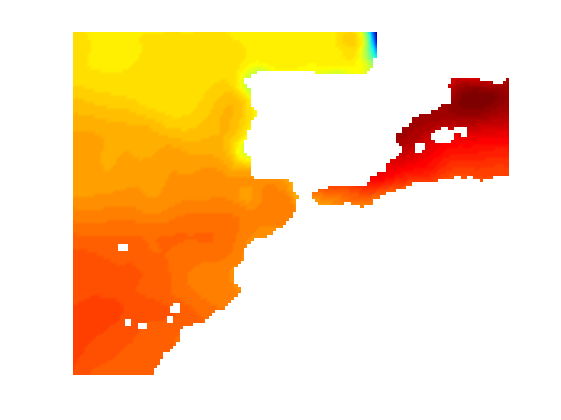
Climatología mensual de salinidad para la zona de Península Ibérica, Baleares e Islas canarias, con resolución espacial de 0.2º y 33 niveles verticales.
-
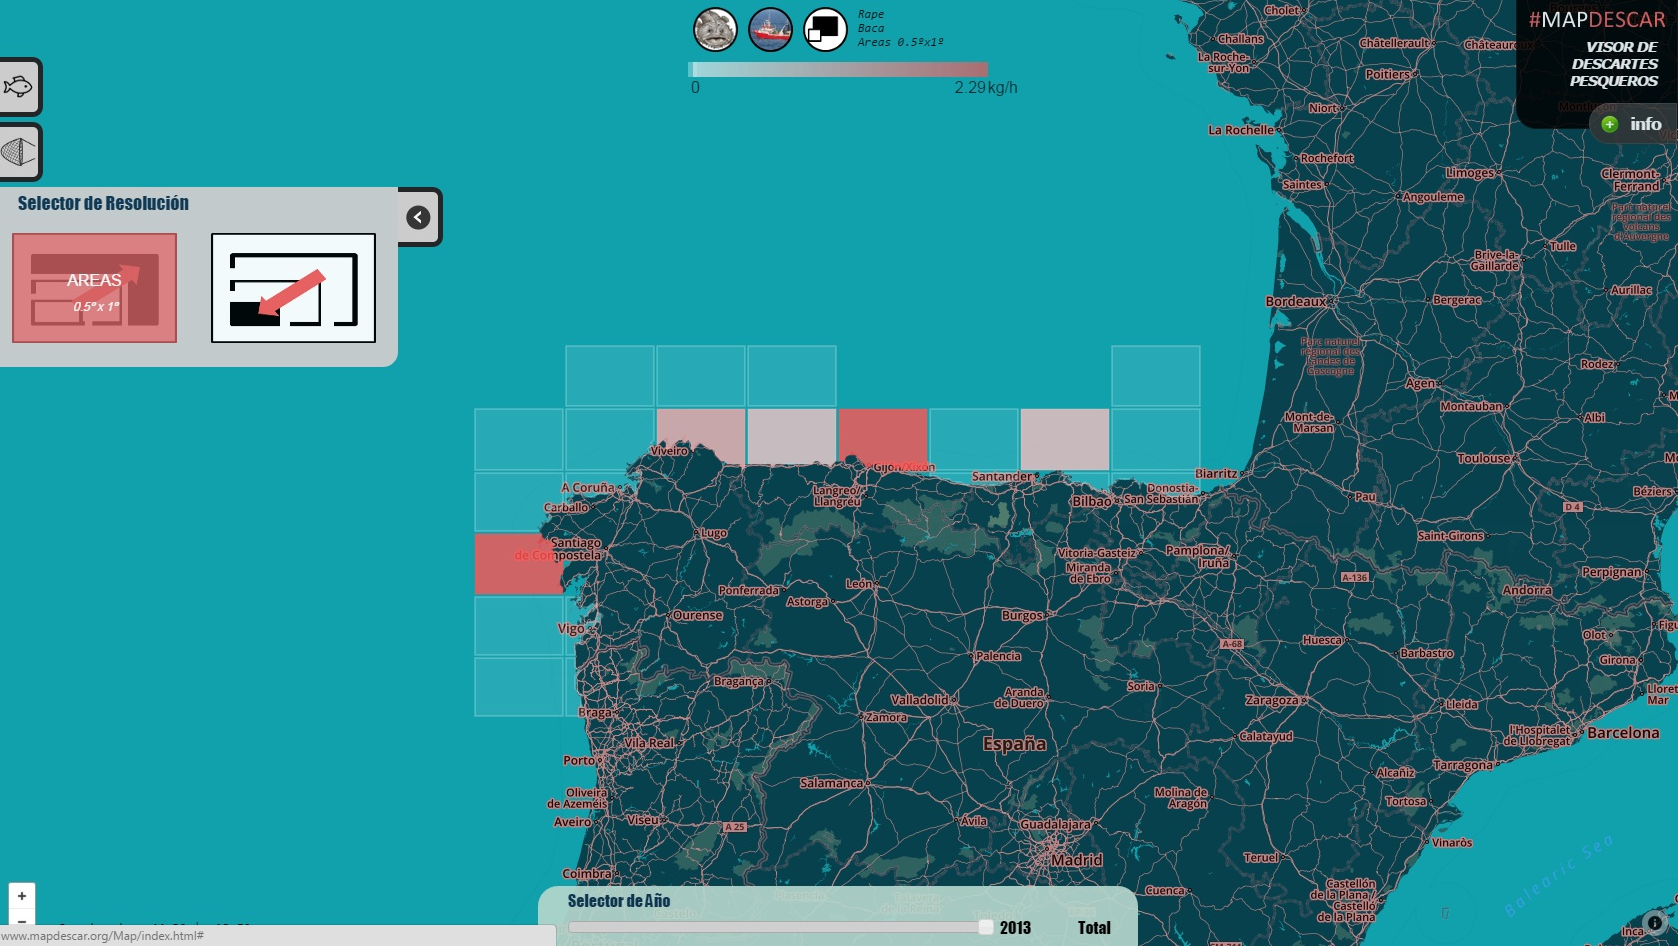
Visor cartográfico que visualiza los datos de descartes pesqueros recogidos por observadores científicos a bordo de buques comerciales. Las unidades hacen referencia a la cantidad de pescado (Kg) que se descarta por hora de pesca o bien por marea en el caso de artes fijas.
-
Estimación del caudal medio diario en la desembocadura para los principales ríos vertiendo a la fachada atlántica y el Golfo de Vizcaya. Comprende estimaciones desde el río Barbate (el más al sur) hasta el río Odet (el más al norte). + info: Otero et al. (2010) "Climatology and reconstruction of runoff time series in northwest Iberia: influence in the shelf buoyancy budget off Ria de Vigo", Scientia Marina 74(2), 247-266
-
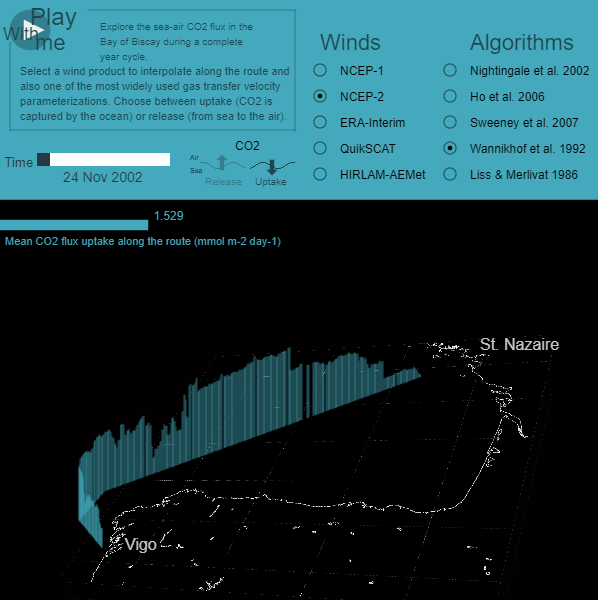
La estimación del flujo de CO2 en la superficie marina es altamente dependiente de la velocidad del viento a través de la parametrización de velocidad de transferencia gaseosa. Esta herramienta permite visualizar esta estimación usando datos obtenidos en un buque de oportunidad que transportaba vehículos de Citröen desde Vigo (España) a Saint Nazaire (Francia), desde octubre de 2002 a Julio de 2003. Puedes explorar la variabilidad especial y temporal del flujo de CO2 a lo largo de la ruta. Además, esta herramienta te permite visualizar las diferencias obtenidas en la estimación cuando se emplea un dato de viento procedente de otra fuente o bien se escoge otro algoritmo diferente para realizar la estimación. Si te gusta esta aplicación o quieres saber más, por favor, visita nuestro artículo publicado en Biogeosciences: Otero, P., X. A. Padin, M. Ruiz-Villarreal, L. M. García-García, A. F. Ríos and F. F. Pérez. Net sea–air CO2 flux uncertainties in the Bay of Biscay based on the choice of wind speed products and gas transfer parameterizations. Biogeosciences, 10, 2993-3005, 2013.
-
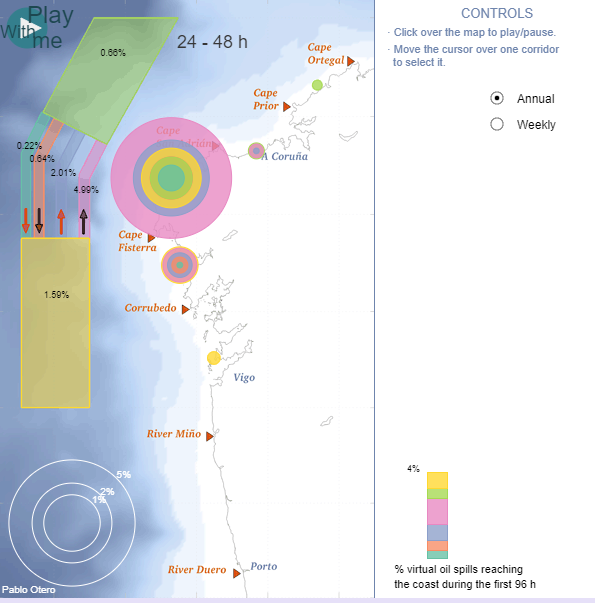
Esta herramienta visualiza la exposición costera de la Eurorregión Galicia - Norte de Portugal a los potenciales vertidos de hidrocarburos que pudieran venir del dispositivo de separación de tráfico de Fisterra. Estos corredores son atravesados cada año por cerca de 40,000 buques; más del 30% de ellos transporta sustancias peligrosas. Estos resultados corresponden a 2012, obtenidos mediante la ejecución de 8,686 simulaciones lagrangianas, cada una de las cuales contó con 2,345 partículas virtuales que fueron arrojadas sobre el corredor y seguidas durante las siguientes 96 horas. Las partículas fueron desplazadas por corrientes superficiales marinas obtenidas de un modelo oceánico realista de alta resolución y también por la acción del viento. Se muestran además de los cuatro corredores que integran el dispositivo, las zonas de aproximación. El número que aparece sobre cada corredor es la probabilidad de que una partícula alcance la costa durante el primer, segundo, tercer o cuarto día tras el vertido. Los círculos representan la probabilidad de que alcance un determinado segmento de la costa. Es posible filtrar los datos colocando el puntero del ratón sobre un determinado corredor, facilitando la visualización.
-
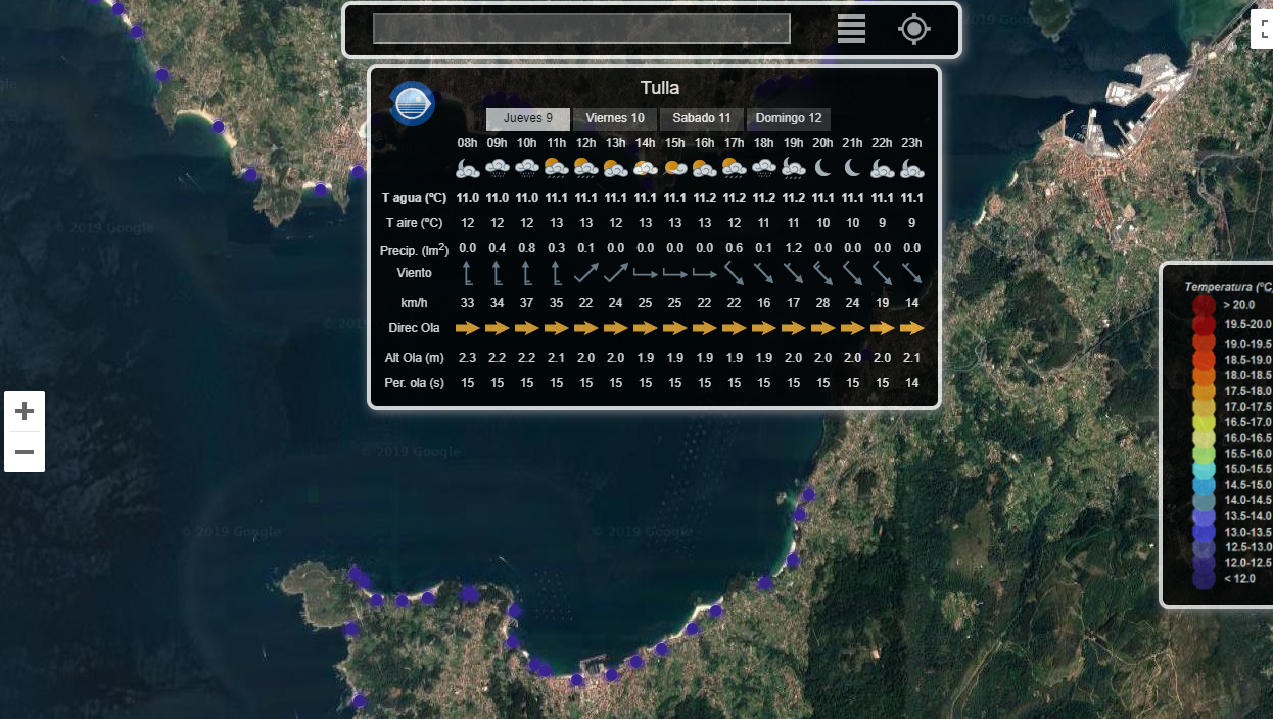
En 2013, el Instituto Español de Oceanografía (IEO) desarrolló un servicio de datos océano-meteorógicos (http://playas.ieo.es) especialmente centrado en proporcionar la temperatura de la superficie del mar en las playas de la cornisa ibérica atlántica. Aunque el servicio web está dirigido a la visualización de la temperatura del agua en más de mil playas, también proporciona un pronóstico de 3 días de un conjunto de otras variables meteoceánicas (temperatura del aire, velocidad y dirección del viento, altura de las olas, período y dirección) y mareas).
-
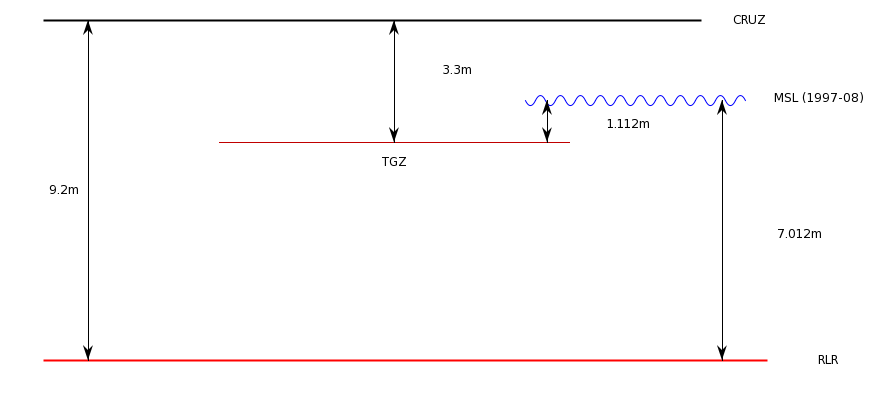
El mareógrafo de Tarifa se encuentra en la zona portuaria. Data del año 1943.
-
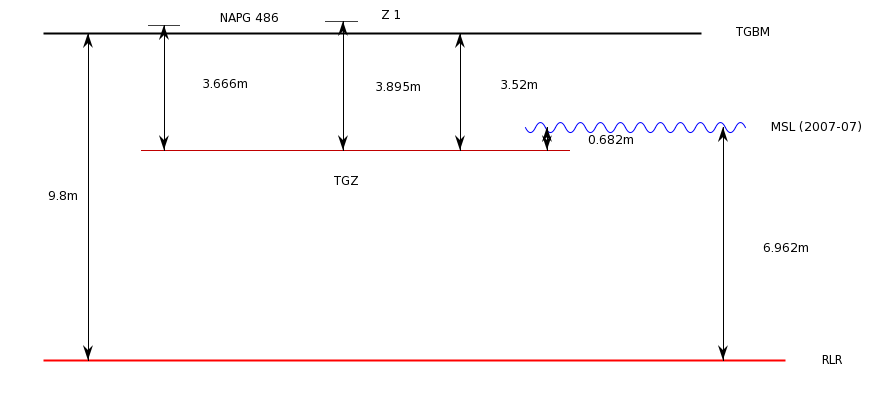
El mareógrafo de Algeciras está situado en la zona portuaria y registra datos del nivel del mar desde noviembre de 2006. Esta estación viene a reemplazar el anterior mareógrafo (PSMSL ID 490) que estuvo tomando registros desde 1943 a 2002.
-
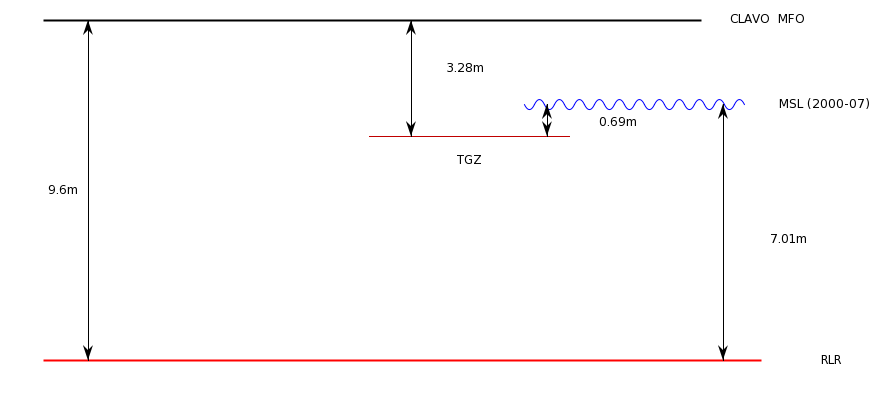
El mareógrafo de Palma de Mallorca se halla ubicado actualmente en el dique del Oeste de Palma. Data del año 1997. Otra estación cercana en el mismo puerto (PSMSL ID 1087) estuvo recogiendo datos de 1964 a 1966.
 Catálogo de datos del IEO