 Catálogo de datos del IEO
Keyword
Chlorophyll-a
1 record(s)
Type of resources
Provided by
Status
-
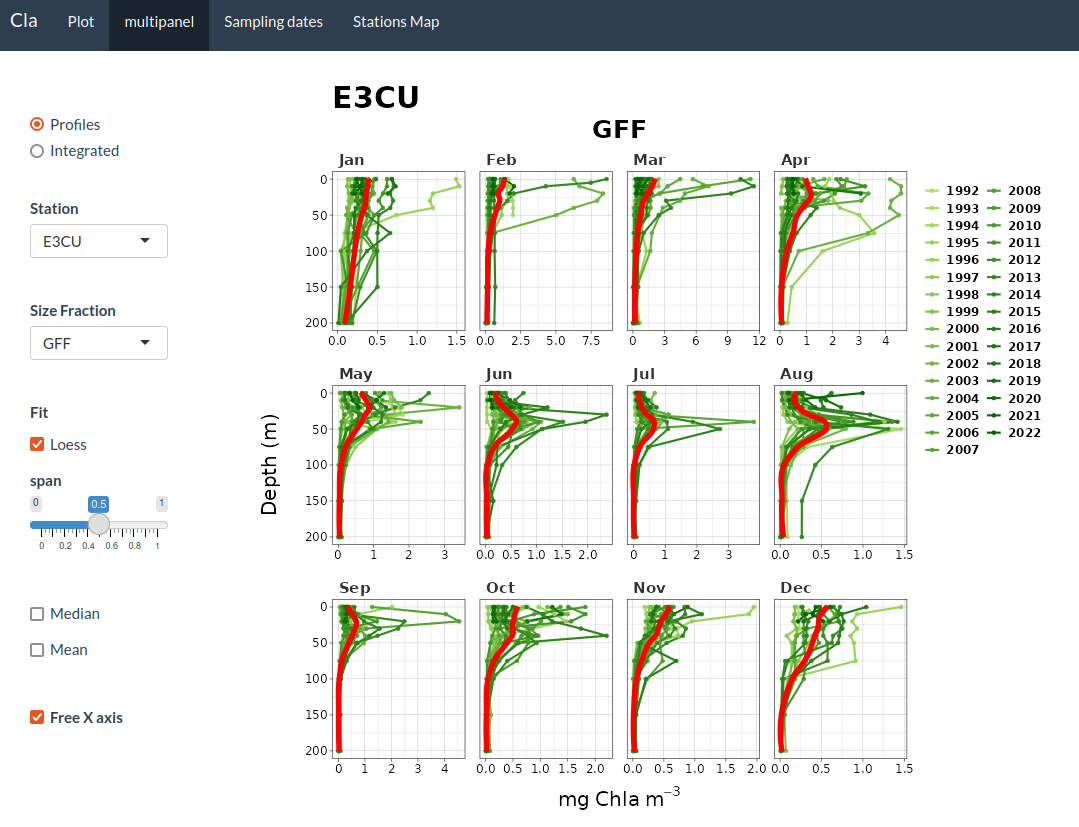
El visor permite la visualización interactiva de los datos de clorofila-a obtenidos cada mes en las campañas RADIALES (llamadas RADCAN o RCAN desde 2013 en el caso de los tres transectos del Cantábrico: Santander, Gijón y Cudillero). Muestra un panel lateral, donde se puede seleccionar la opción deseada para una serie de variables (estación, clase de tamaño, año, tipo de representación gráfica, …) y un panel principal donde aparecen los gráficos. Está organizado en cuatro pestañas: [1] 'Plot’ presenta los datos de una única estación (la lista de todas las estaciones y sus coordenadas geográficas están en https://seriestemporales-ieo.net, y representadas en un mapa en la última pestaña de este visor). [2] ‘multipanel’ muestra simultáneamente los gráficos individuales de todas las estaciones, facilitando la comparación entre ellas. [3] ‘Sampling dates’ representa gráficamente los meses, desde el inicio del proyecto, en que hay datos de clorofila disponibles. [4] ‘Stations Map’ muestra el mapa con la posición de todas las estaciones.